
Blog analytics and heatmaps
See which blog posts bring sales in Shopify
vevy analytics show how your blog posts perform: which posts get read, what readers click and which posts lead to sales. This helps you decide which topics to write about next and where to place your products.
Analytics are available on the Starter and Pro plans. Heatmaps and conversion tracking are available on the Pro plan.
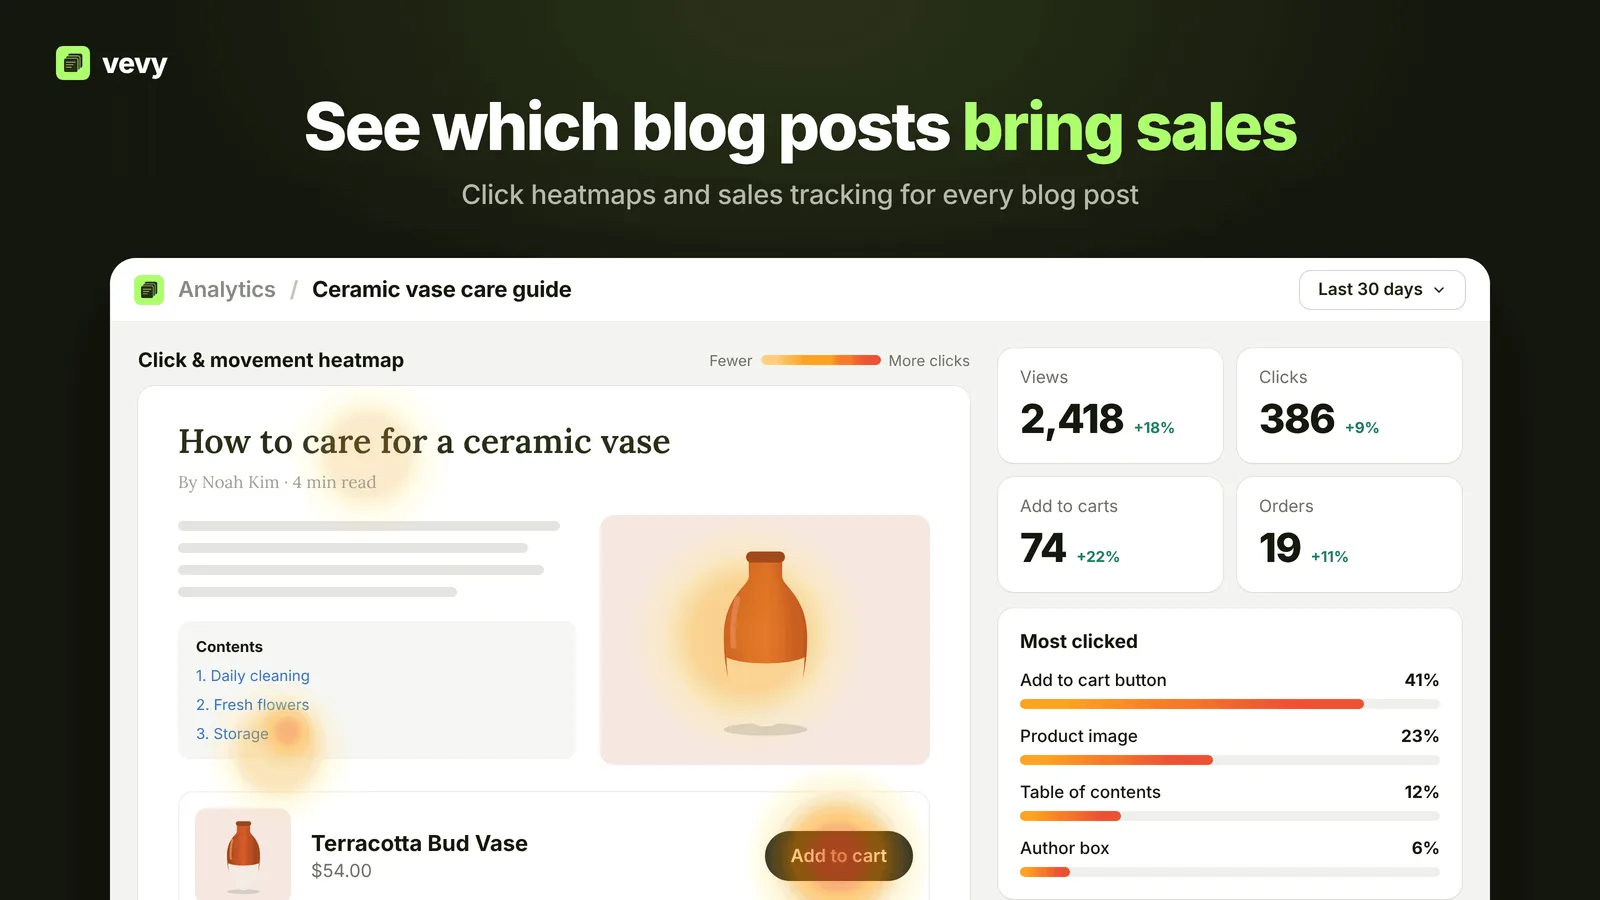
What vevy tracks
For your blog and for each article, vevy shows:
For your blog and for each article, vevy shows:
| Metric | What it tells you |
| Views | How many times the post was viewed |
| Clicks | How many clicks readers made in the post |
| Add to carts | How many products readers added to the cart from the post |
| Orders | How many orders came from the post |
| Revenue | How much revenue came from the post |
Where to find your analytics
- Blogs dashboard: The Store performance card shows views, clicks, orders and revenue for your blog. Use the date menu to change the time range.
- Analytics page: Go to Analytics in the vevy menu to see how your posts perform.
- Per article: Open the analytics of a single article to see its views, clicks, add to carts, orders and revenue.
Click & movement heatmap (Pro)
The click and movement heatmap shows where readers click and move on an article. You can see which products and buttons get clicks.
To open it:
-
Go to the Blogs dashboard.
-
In the right sidebar, find the Click & movement heatmap card.
-
Click Analyze.
Use what you learn
- When a post gets many views but few add to carts, try moving the product block higher in the post.
- When a product or button gets many clicks, use a similar block in other posts on the same topic.
- When a post brings orders, write more posts on that topic.